Europa
Niederlande
auch: Holland
Steckbrief
- Hauptstadt
- Amsterdam
- Kontinent
- Europa
- Staatsform
- Parlamentarische Monarchie
- Sprachen
- Niederländisch, Friesisch
- Währung
- Euro (EUR)
- Vorwahl
- +31
- Domain
- .nl
- Zeitzone (Hauptstadt)
- UTC+1
- Fahrseite
- Rechtsverkehr
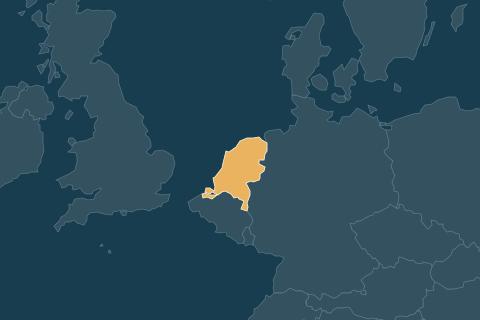
2 Nachbarländer · Grenze in km
- Deutschland575 km
- Belgien478 km
Wirtschaft
Woher kommt das BIP? · 2024
- Landwirtschaft1,7 %
- Industrie17,9 %
- Dienstleistungen70,3 %
Wofür wird es ausgegeben? · 2023
- Konsum der Haushalte42,1 %
- Staatsausgaben24,5 %
- Investitionen20,1 %
- Lagerbestände-0,1 %
- Exporte88,5 %
- Importe-77,4 %
in % des BIP · Importe zählen negativ
Wichtigste Exporte · 2023
- Erdölprodukte
- Impfstoffe
- Maschinen
- Rohöl
- Sendetechnik und Handys
Geht vor allem nach
- Deutschland16 %
- Belgien15 %
- Frankreich11 %
- Italien6 %
- Vereinigte Staaten6 %
Wichtigste Importe
- Rohöl
- Erdölprodukte
- Sendetechnik und Handys
- Autos
- Erdgas
Kommt vor allem aus
- Deutschland16 %
- Belgien10 %
- China10 %
- Vereinigte Staaten10 %
- Vereinigtes Königreich5 %
Bodenschätze & Rohstoffe
Landwirtschaft: die 10 größten Erzeugnisse
nach Menge (Tonnen)
Menschen
Altersstruktur
- unter 15 Jahre14,9 %
- 15 bis 64 Jahre64,2 %
- 65 und älter20,9 %
Stadt und Land
- in Städten95,9 %
- auf dem Land4,1 %
Im Vergleich mit den Nachbarn
- Niederlande73.684 US$
- Belgien60.750 US$
- Deutschland60.496 US$
Weltweiter Mittelwert (Median): 7.778 US$ · Niederlande: Platz 11 von 193
Alle Zahlen
dieselben Werte wie in Higher LowerZahlen & Fakten
| Einwohner | 18,1 Mio. | Platz 71 von 195 | 2025 |
|---|---|---|---|
| Fläche | 41.540 km² | Platz 131 von 194 | 2024 |
| Einwohner pro km² | 534 pro km² | Platz 15 von 194 | 2024 |
| Wirtschaftsleistung (BIP) | 1,33 Bio. US$ | Platz 18 von 193 | 2025 |
| BIP pro Kopf | 73.684 US$ | Platz 11 von 193 | 2025 |
| Lebenserwartung | 82 Jahre | Platz 31 von 195 | 2024 |
| Glücks-Wert (World Happiness Report) | 7,22 von 10 | Platz 7 von 146 | 2026 |
| Menschliche Entwicklung (HDI) | 0,955 von 1 | Platz 8 von 192 | 2023 |
| Kinder pro Frau | 1,43 Kinder | Platz 154 von 195 | 2024 |
| Medianalter | 42,2 Jahre | Platz 36 von 193 | 2025 |
| Anteil über 65-Jährige | 20,9 % | Platz 25 von 195 | 2025 |
| Anteil unter 15-Jährige | 14,9 % | Platz 168 von 195 | 2025 |
| Anteil Stadtbevölkerung | 95,9 % | Platz 8 von 195 | 2025 |
| Internetnutzer | 97 % | Platz 17 von 193 | 2024 |
| Handyverträge pro 100 Einwohner | 129 pro 100 | Platz 58 von 195 | 2024 |
| Waldanteil | 11 % | Platz 154 von 194 | 2024 |
| Anteil Ackerland | 29,8 % | Platz 28 von 191 | 2024 |
| CO₂ pro Kopf | 6,6 t pro Jahr | Platz 34 von 186 | 2024 |
| Strom aus Erneuerbaren | 33,1 % | Platz 85 von 190 | 2021 |
| Arbeitslosenquote | 3,9 % | Platz 115 von 179 | 2025 |
| Ärzte pro 1.000 Einwohner | 3,88 pro 1.000 | Platz 34 von 189 | 2022 |
| Krankenhausbetten pro 1.000 Einwohner | 2,9 pro 1.000 | Platz 61 von 153 | 2020 |
| Alter der Mutter beim ersten Kind | 30,2 Jahre | Platz 13 von 129 | 2020 |
| Ausgaben für Bildung | 5,2 % des BIP | Platz 55 von 180 | 2022 |
| Exporte | 81 % des BIP | Platz 12 von 173 | 2025 |
| Militärausgaben | 2,5 % des BIP | Platz 43 von 164 | 2025 |
| Ungleichheit (Gini-Index) | 25,7 von 100 | Platz 140 von 145 | 2021 |
| Flugpassagiere pro Jahr | 41,4 Mio. | Platz 28 von 152 | 2023 |
| Höchster Punkt | 862 mHöchster Punkt: Mount Scenery (on the island of Saba in the Caribbean, now considered an integral part of the Netherlands following the dissolution of the Netherlands Antilles) | Platz 156 von 191 | Quelle |
| Mittlere Höhe des Landes | 30 m | Platz 156 von 162 | Quelle |
| Küstenlänge | 451 kmZu Fuß bei 30 km am Tag: ≈ 15 Tage | Platz 99 von 194 | Quelle |
| Länge der Landgrenzen | 1.053 km | Platz 122 von 194 | Quelle |
| Höhe der Hauptstadt | -2 m | Platz 194 von 195 | Quelle |
| Durchschnittstemperatur | 10,5 °C | Platz 156 von 196 | Quelle |
| Einwohner der Hauptstadt (Ballungsraum) | 1,2 Mio.Ballungsraum Amsterdam | Platz 106 von 117 | 2023 |
Zum Spaß
| Anzahl Nachbarländer | 2 Länder | Platz 118 von 197 | Quelle |
|---|---|---|---|
| Anzahl Amtssprachen | 1 Sprachen | Platz 97 von 197 | Quelle |
| Olympia-Medaillen (alle Zeiten) | 524 Medaillen | Platz 14 von 138 | 2026 |
| Nobelpreisträger | 22 Personen | Platz 11 von 79 | 2025 |
| Eurovision-Siege | 5 Siege | Platz 6 von 48 | 2026 |
| Autos pro 1.000 Einwohner | 513 pro 1.000 | Platz 44 von 171 | 2024 |
| Bier pro Kopf | 79,3 Liter pro Jahr≈ 7,9 Kästen (20 × 0,5 l) pro Person und Jahr | Platz 13 von 61 | 2019 |
| Wein pro Kopf | 2,92 Liter reiner Alkohol | Platz 23 von 186 | 2019 |
| Alkohol pro Kopf | 8,2 Liter reiner Alkohol | Platz 39 von 186 | 2019 |
| Tee pro Kopf | 0,78 kg pro Jahr≈ 1,1 Tassen am Tag (2 g pro Tasse) | Platz 16 von 54 | Quelle |
| Milch pro Kopf | 342 kg pro Jahr≈ 4,7 Gläser (0,2 l) am Tag | Platz 4 von 175 | 2013 |
| Fleisch pro Kopf | 75,8 kg pro Jahr≈ 9,7 Schnitzel (150 g) pro Woche | Platz 36 von 164 | 2020 |
| Anteil Raucher | 18,7 % | Platz 75 von 166 | 2025 |
| Starkes Übergewicht (Erwachsene) | 20,4 % | Platz 96 von 189 | 2016 |
| Flughäfen und Flugplätze | 44 Stück | Platz 94 von 190 | 2025 |
| Länge des Schienennetzes | 3.055 km7,6 % einer Runde um den Äquator | Platz 57 von 133 | 2020 |
| Milliardäre | 13 Personen | Platz 29 von 74 | 2026 |
| Anzahl Inseln | 34 Inseln | Platz 75 von 95 | Quelle |
| Atomreaktoren in Betrieb | 1 Reaktoren | Platz 29 von 34 | Quelle |
| Festnetz-Internet pro 100 Einwohner | 43 pro 100 | Platz 52 von 192 | 2023 |
Kurioses
| Buchstaben im deutschen Ländernamen | 11 Buchstaben„Niederlande“ | Platz 28 von 197 | Quelle |
|---|---|---|---|
| Fläche in Saarländern | 16,2 Saarländer | Platz 131 von 194 | 2024 |
| Hubschrauber-Landeplätze | 194 Stück | Platz 15 von 144 | 2025 |
| Handelsschiffe unter eigener Flagge | 1.187 Schiffe | Platz 20 von 165 | 2023 |
| McDonald’s-Filialen | 266 Filialen1 Filiale auf 68.000 Menschen | Platz 23 von 92 | 2025 |
GeoGuessr
Street View in GeoGuessrFahrseite: rechtsLädt …
Quizzes
0 Quizzes mit NiederlandeNoch keine freigeschalteten Quizzes mit Niederlande.
Auch dabei: Higher Lower – welches Land hat mehr Einwohner, Bier, Küste …?
Wirtschaft, Handel, Rohstoffe, Sprachen, Staatsform und Grenzen: CIA World Factbook, gemeinfrei, eigene Übersetzung. Zahlen: wie bei Higher Lower (Weltbank, CIA, Wikipedia u. a. – Jahr anklicken für die Quelle). Karten: Natural Earth und die Ebenen der Atlas-Quizzes. Alle Quellen